
Measurement and commissioning 10 min read
Audio Measurement and Commissioning
Use spectrum and transfer-function measurements, coherence, delay finding and spatial averaging to verify and commission an AV system.
- Distinguish an RTA from a transfer-function measurement.
- Explain magnitude, phase, impulse response and coherence.
- Use delay measurements to align loudspeaker zones.
- Choose useful measurement positions and averaging methods.
- Follow a repeatable audio-commissioning sequence.
Why an AV engineer should care
A system can sound acceptable from the rack and terrible at the conference table. It can also produce a beautiful frequency-response graph at one chair while sounding inconsistent everywhere else.
Commissioning connects the design, DSP file and physical room. It answers measurable questions:
- Did every loudspeaker get connected to the correct amplifier channel?
- Do adjacent loudspeaker zones arrive together?
- Is coverage reasonably consistent across the audience?
- Is the system adding a broad tonal imbalance?
- Is background noise defeating speech intelligibility?
- Did the DSP changes improve the whole room or merely one microphone position?
Measurement software does not tune the system for you. It gives you evidence. The engineer still has to decide what is physically real, what is correctable and what is just a tiny squiggle begging for attention.
1. Start with the performance requirement
Before measuring anything, establish what the system is supposed to do.
Useful criteria may include:
- Speech coverage and intelligibility
- Program-audio bandwidth
- Maximum operating SPL
- Background-noise level
- Signal-to-noise ratio
- Coverage uniformity
- Gain before feedback
- Acceptable latency
- AEC and double-talk performance
AVIXA’s performance-verification framework treats commissioning as verification against documented criteria, with defined measurements and reporting rather than a final “sounds good to me” walkthrough. (avixa.org, avixa.org)
A conference room, auditorium and background-music system should not share identical targets. Define the application before choosing the test.
2. The basic measurement equipment
A practical field kit includes:
- Calibrated omnidirectional measurement microphone
- Microphone calibration file
- Two-channel audio interface
- Measurement software
- Appropriate analog, USB or Dante connections
- Calibrated sound-level meter when required
- Microphone stand
- Test signals
- Headphones
- Polarity and cable-testing tools
The measurement microphone should be placed at listening height—not on the conference table because the tripod was annoying.
Its calibration file corrects known deviations in that specific microphone. Biamp recommends using microphone calibration data when accurate acoustic frequency-response measurements are required. (support.biamp.com)
For formal compliance, use instrumentation meeting the specification’s accuracy requirements. A phone app can identify obvious differences. It does not become a calibrated Type 1 or Type 2 sound-level meter because the interface has attractive colors.
3. RTA: what energy exists here?
An RTA, or real-time analyzer, displays signal level by frequency band at one measurement input.
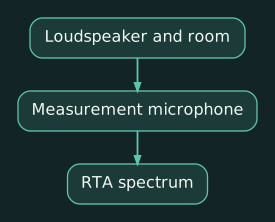
It can show:
- Excessive low-frequency energy
- A broad midrange buildup
- HVAC tones
- Feedback frequencies
- Spectral differences between seats
- The spectrum of speech, noise or program material
The limitation is that an RTA sees only the result. It does not know what the original signal contained.
If music has weak energy at 8 kHz, the RTA cannot determine whether:
- The recording lacks 8 kHz energy.
- The loudspeaker is rolling off.
- The microphone is off-axis.
- The room is absorbing it.
- The measurement system is wrong.
An RTA is useful for observation and comparison. It is not, by itself, a complete measurement of the system’s frequency response.
4. Transfer function: what did the system change?
A dual-channel transfer-function measurement compares:
- A reference copy of the original test signal
- The measured result after the signal passes through the DSP, amplifier, loudspeaker and room
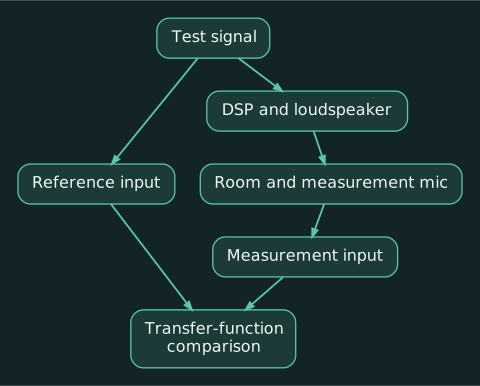
Because the analyzer knows both signals, it can calculate:
- Magnitude: Level difference by frequency
- Phase: Timing relationship by frequency
- Coherence: Stability and reliability of the measurement
- Impulse response: System behavior over time
- Delay: Arrival-time difference between reference and measurement
Smaart, for example, separates single-channel spectrum analysis from dual-channel transfer-function measurements providing magnitude, phase, coherence and impulse-response data. (support.rationalacoustics.com, support.rationalacoustics.com)
This is the proper tool for loudspeaker alignment and detailed system tuning.
5. Measurement delay must be set
The reference signal reaches the analyzer electrically, almost immediately. The measured signal must pass through:
- DSP processing
- Network buffering
- DAC conversion
- Amplifier
- Loudspeaker
- Air
The analyzer must delay the reference internally so the two signals line up in time.
A delay finder calculates that offset. Rational Acoustics defines it as the difference in arrival time between the measurement and reference signals. (support.rationalacoustics.com)
If the measurement delay is wrong:
- High-frequency phase becomes difficult to interpret.
- Magnitude data may become unstable.
- Coherence often falls at higher frequencies.
- A useful measurement can look like modern art.
Recheck delay whenever you:
- Move the measurement microphone significantly
- Change loudspeaker zones
- Insert processing with additional latency
- Change interface or signal routing
- Enable a manufacturer FIR preset
A useful approximation is:
- 1 ms ≈ 1.13 feet
- 1 ms ≈ 0.343 metres
That converts measurement delay into an approximate acoustic path difference, although the measured value also includes electronic latency.
6. Impulse response: seeing arrivals over time
The impulse response shows when acoustic energy reaches the measurement microphone.
It can reveal:
- Direct loudspeaker arrival
- A second loudspeaker arriving later
- Strong wall or ceiling reflections
- Subwoofer arrival
- DSP latency
- Polarity relationships
- Reverberant decay
Suppose the main loudspeaker reaches a rear listening position at 38 ms, while a nearby delay speaker arrives at 13 ms. The delay speaker is 25 ms early relative to the main.
Add approximately 25 ms of delay to the delay speaker as the starting point, then measure again and refine the result.
The objective is not always mathematically identical arrival. Depending on the design, the fill may intentionally arrive slightly after the main so listeners localize speech toward the front. That is a design choice; “zero milliseconds because the default looked clean” is not.
7. Coherence is confidence, not sound quality
Coherence indicates how consistently the measurement signal relates to the reference at each frequency.
Values are commonly shown from 0 to 1 or 0% to 100%.
High coherence generally means the analyzer has reliable data. Low coherence may result from:
- Incorrect measurement delay
- Insufficient test-signal level
- Background noise
- Other loudspeakers or sources operating
- Movement in the room
- Wind or HVAC turbulence
- Nonlinear distortion
- Reverberation
- A time-varying system such as an active compressor or AGC
Rational Acoustics describes coherence as a data-quality indicator based on the measurement’s stability and consistency. It specifically identifies incorrect delay as a common cause of poor high-frequency coherence. (support.rationalacoustics.com)
Do not apply EQ where coherence indicates unreliable data. The graph may be describing noise and changing reflections rather than the loudspeaker.
High coherence also does not mean the system sounds good. It can provide a beautifully reliable measurement of a terrible response.
8. Smoothing and averaging
An unsmoothed response contains many narrow peaks and dips caused by reflections and tiny position changes.
Trying to flatten every one produces:
- Excessive filters
- Lost headroom
- Worse performance at nearby seats
- A DSP file that looks like someone lost a fight with a parametric EQ
Use smoothing appropriate to the task:
- Broad smoothing for overall tonal balance
- Finer smoothing for crossover and loudspeaker investigation
- Minimal smoothing only when the data quality and purpose justify it
Average several representative positions:
- Front, middle and rear
- Left, center and right
- Primary conference seats
- Accessible seating
- Combined and divided room configurations
Do not average unrelated acoustic zones into one meaningless curve. Analyze each zone first, then assess the combined audience area.
AVIXA’s spectral-balance standard establishes a procedure for measuring and documenting frequency-response consistency across listener areas rather than judging a single favored seat. (avixa.org, api.avixa.org)
9. Target curves
A technically flat response is not automatically the desired in-room result.
Depending on the application, a useful target may include:
- Controlled low-frequency extension
- A relatively smooth speech band
- A gentle high-frequency downward trend
- Reduced energy outside the loudspeaker’s useful range
The objective is a defined, repeatable spectral balance—not necessarily a ruler-flat line at every seat.
Avoid deriving an extreme inverse EQ from one measurement. Correct broad, repeatable trends that appear across multiple positions. Leave narrow position-dependent cancellations alone unless you have identified a correctable cause.
10. Practical example: conference room
For a room using an MXA microphone, Q-SYS or Tesira DSP and ceiling loudspeakers:
- Record ambient noise with the AV system off.
- Verify every loudspeaker and amplifier channel.
- Load and confirm manufacturer presets.
- Measure one loudspeaker zone at a time.
- Confirm polarity and arrival time.
- Measure several seated positions.
- Apply modest room EQ to broad, consistent problems.
- Verify speech and program levels.
- Test STI or another specified intelligibility metric.
- Place a real call and record near-end and far-end performance.
Biamp recommends documenting the ambient noise floor and preserving recordings of both the direct DSP USB path and the complete UC call path for future comparison. (support.biamp.com, support.biamp.com)
That final recording becomes a valuable baseline when the client reports six months later that “the microphone suddenly sounds weird.”
11. Practical example: mains, fills and subwoofer
For a multipurpose room:
- Measure the main loudspeakers alone.
- Measure each fill independently.
- Find the main arrival at the fill’s listening area.
- Delay the fill to align with the intended main arrival.
- Verify polarity and phase through the overlap region.
- Measure the subwoofer and mains separately.
- Adjust sub delay, polarity and level around the crossover.
- Measure the combined system.
- Confirm coverage at multiple audience positions.
- Save the measurements before and after processing.
A deep crossover notch should prompt investigation of polarity and arrival time before EQ. You cannot equalize two sources into agreeing about what time it is.
Practical exercise
Using any RTA application:
- Play pink noise through one loudspeaker.
- Observe the spectrum from a fixed position.
- Move the microphone one foot and compare the response.
- Move it near a wall and compare again.
- Apply a narrow EQ boost and observe whether it appears consistently.
- Remove the boost before it becomes a permanent design decision.
The exercise demonstrates why one RTA trace cannot define the room. Small position changes alter reflection-driven peaks and cancellations, while broad loudspeaker trends remain more consistent.
Compact glossary
- RTA: Real-time analyzer displaying signal energy by frequency.
- Transfer function: Comparison of a system’s measured output with its original reference.
- Magnitude: Level response by frequency.
- Phase: Timing relationship by frequency.
- Impulse response: System behavior over time after an impulse.
- Coherence: Indicator of transfer-function data reliability.
- Reference channel: Original signal used for comparison.
- Measurement delay: Timing offset used to align reference and measured signals.
- Smoothing: Reduction of visible narrowband detail in a response trace.
- Spatial average: Combination of measurements from multiple positions.
- SPL: Sound-pressure level.
- STI: Speech Transmission Index.
Review questions
- Why can’t an RTA alone determine a loudspeaker’s frequency response?
- What does low coherence tell you?
- Why should room EQ be based on several measurement positions?
Answers
-
It shows only the measured spectrum and cannot separate the source’s content from changes introduced by the system and room.
-
The transfer-function data is unstable or poorly related to the reference at that frequency. Check delay, noise, signal level and time-varying conditions before applying EQ.
-
Narrow peaks and dips change with position. Multiple measurements identify broad, repeatable problems affecting the actual listener area.